> ## Documentation Index
> Fetch the complete documentation index at: https://docs.blaxel.ai/llms.txt
> Use this file to discover all available pages before exploring further.
# Logs & traces
> Get automatic logging, distributed tracing, and real-time metrics including latency, token usage, and request data for agents deployed on Blaxel.
Deploying and running agents on Blaxel gives you **total observability by design**, without needing to install any additional library. When you either deploy from the console’s low-code builder or by using the Blaxel SDK to wrap your code for deployment, Blaxel will automatically implement logging & tracing on your requests.
## Monitor from the Blaxel console
There are three ways you can observe and monitor your running workloads:
* Metrics
* Logs
* Traces
### Metrics
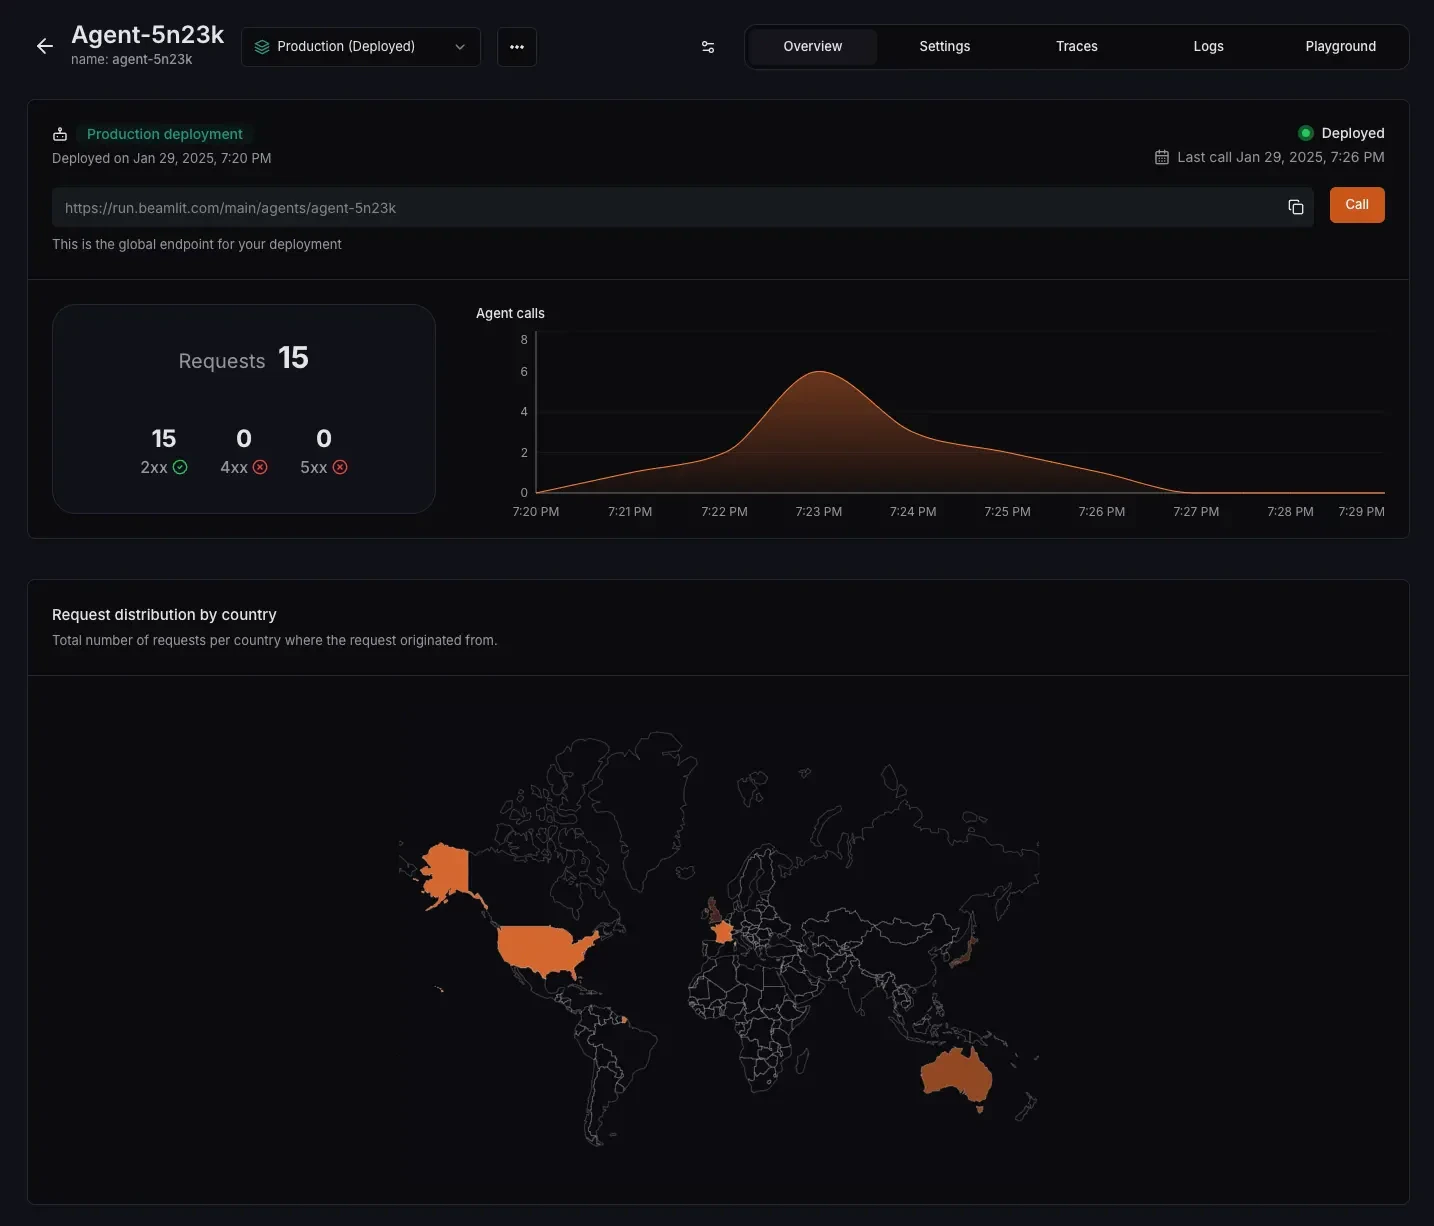
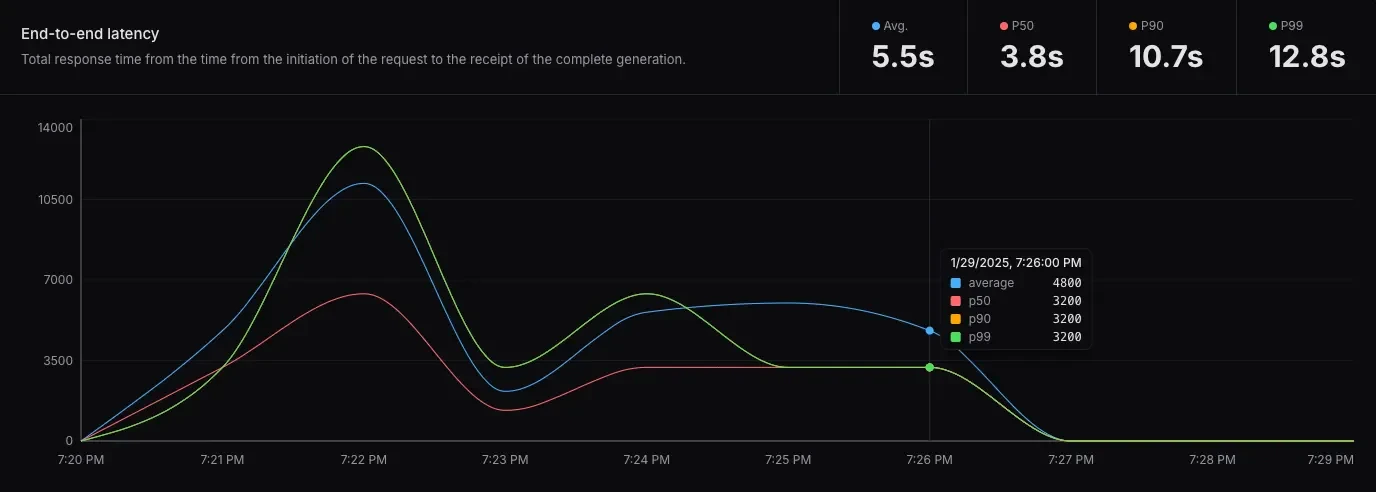
Metrics are aggregated data about workload executions. They include:
* Number and rate of requests
* End-to-end latency: average, p50, p90, p99
* Number of tokens generated by model APIs: input, output and total
* City and country of origin of all requests
 ### Logs
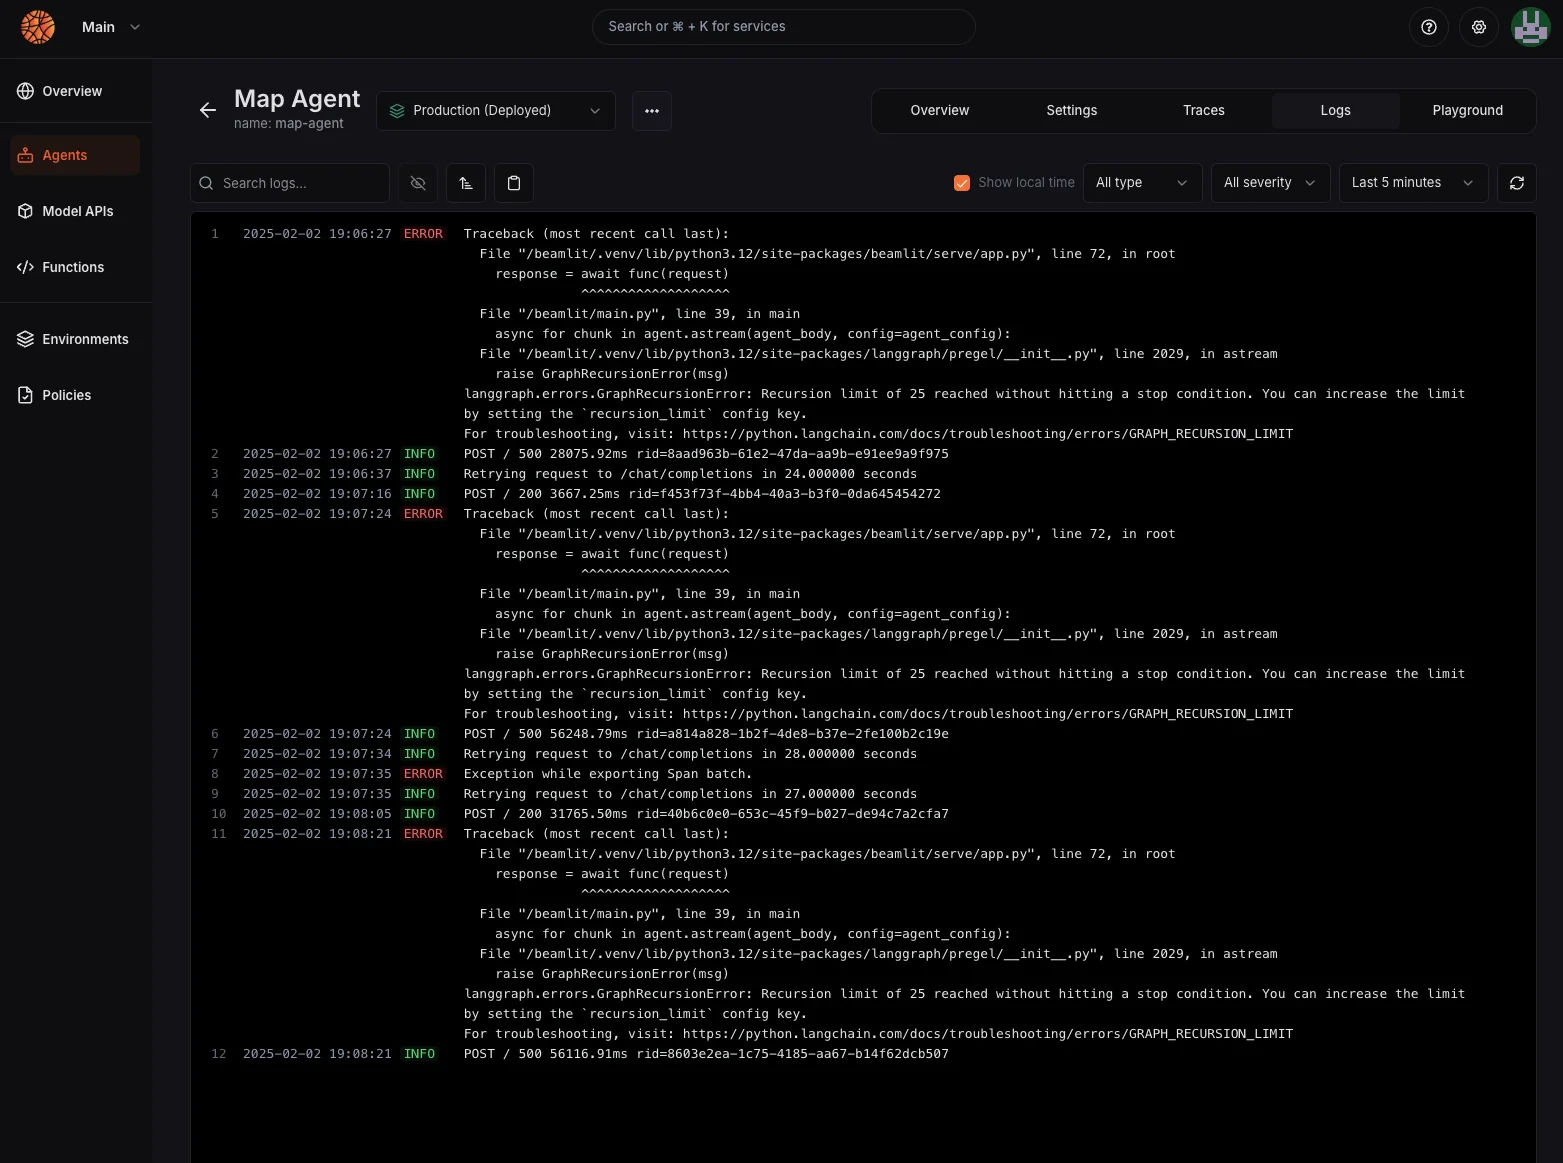
Logs are timestamped data about what happens with your agents, functions and model APIs. Such data includes:
* Status of all requests on agents, functions and model APIs
* Logs generated when building your deployments
* Custom logs generated by your agents and functions
### Logs
Logs are timestamped data about what happens with your agents, functions and model APIs. Such data includes:
* Status of all requests on agents, functions and model APIs
* Logs generated when building your deployments
* Custom logs generated by your agents and functions
 ### Traces
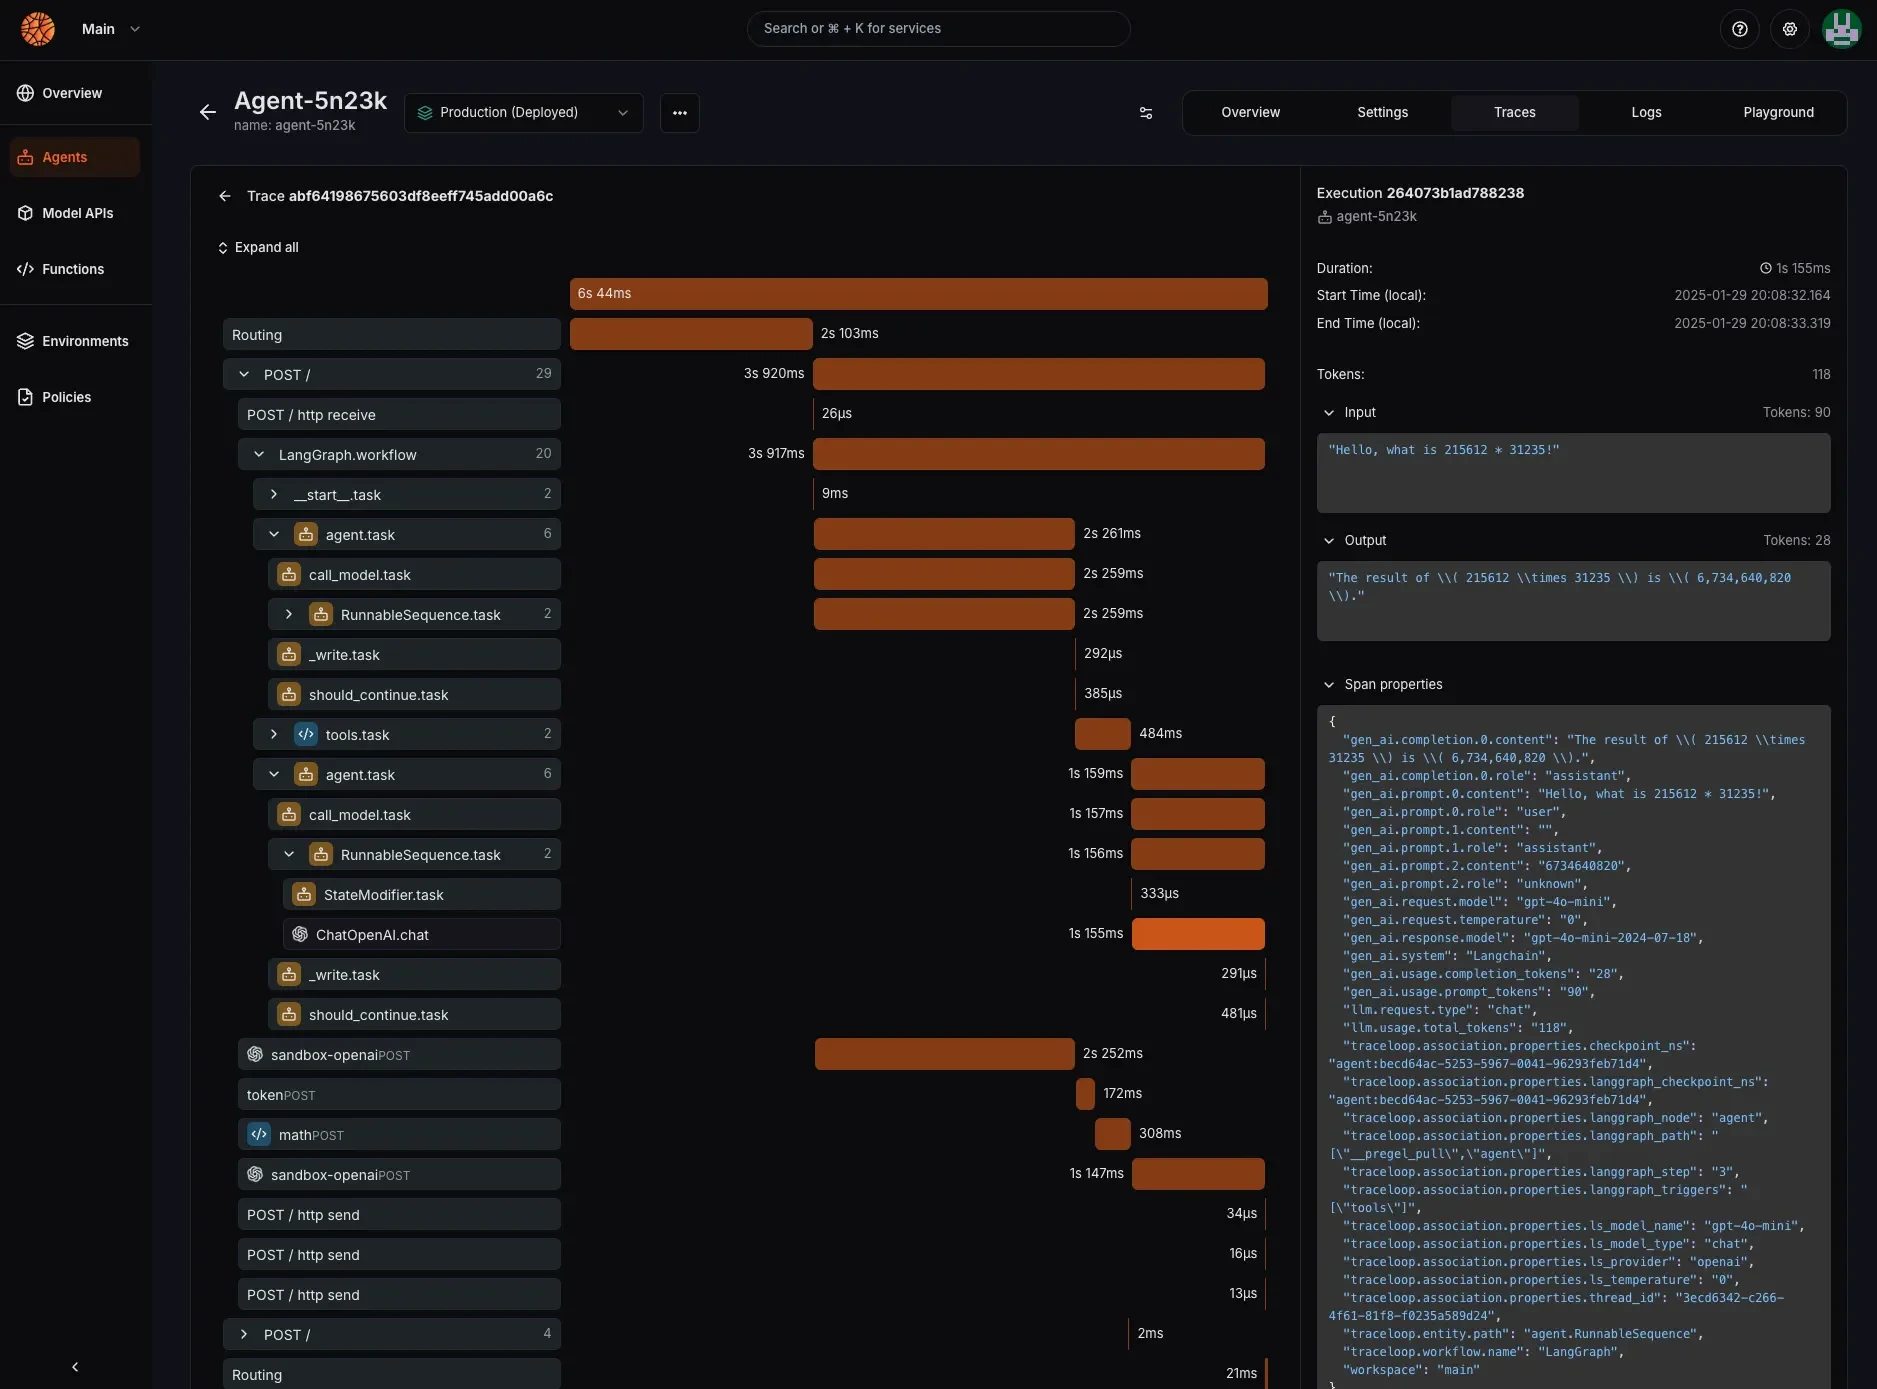
Tracing helps you understand how your agent works by showing you all its parts in action. When you make a request, it creates a trace that contains multiple *spans*.
Think of a span as a building block - it shows when something starts and ends, what went in, what came out, and other useful details. Spans can contain other spans, like when one function calls another. You'll often see spans for things like LLM calls, tool calls, or steps in an agent's process. You can click on any trace to see all its spans laid out clearly. This makes it much easier to follow how your agent works and fix any problems you find.
Blaxel collects and saves the traces of a **sampled 10%** of all your executions. In order to force saving the trace on an execution, call the run API and add query parameter `debug:true`.
### Traces
Tracing helps you understand how your agent works by showing you all its parts in action. When you make a request, it creates a trace that contains multiple *spans*.
Think of a span as a building block - it shows when something starts and ends, what went in, what came out, and other useful details. Spans can contain other spans, like when one function calls another. You'll often see spans for things like LLM calls, tool calls, or steps in an agent's process. You can click on any trace to see all its spans laid out clearly. This makes it much easier to follow how your agent works and fix any problems you find.
Blaxel collects and saves the traces of a **sampled 10%** of all your executions. In order to force saving the trace on an execution, call the run API and add query parameter `debug:true`.
 #### Add custom spans
You can add your own information to traces, such as inputs, outputs, and intermediate results. This is useful when you need to perform detailed debugging.
```typescript TypeScript theme={null}
import "@blaxel/telemetry";
import { startSpan } from "@blaxel/telemetry";
const span = startSpan("span-name", {
attributes: {
"input": JSON.stringify(userInput),
},
});
try {
// ... your code here ...
span.setAttribute("action.result", JSON.stringify(result));
} finally {
span.end();
}
```
```python Python theme={null}
import blaxel.telemetry
from opentelemetry import trace
tracer = trace.get_tracer(__name__)
with tracer.start_as_current_span("span-name", attributes={"input": user_input}) as span:
# ... your code here ...
span.set_attribute("action.result", str(result))
```
You can call `startSpan` anywhere inside a request handler, and the span will be attached to the active trace for that request.
## Opt out
This feature is controlled by the `BL_ENABLE_OPENTELEMETRY` environment variable.
When you deploy an agent to Blaxel, the platform automatically injects `BL_ENABLE_OPENTELEMETRY=true` into the environment.
When developing locally, this environment variable is not set and therefore defaults to `false`.
To explicitly disable telemetry:
```bash theme={null}
export BL_ENABLE_OPENTELEMETRY=false
```
Setting `DO_NOT_TRACK=1` has no effect on OpenTelemetry.
[Read more about SDK and CLI data collection and privacy](/Security/Data-collection-and-privacy).
#### Add custom spans
You can add your own information to traces, such as inputs, outputs, and intermediate results. This is useful when you need to perform detailed debugging.
```typescript TypeScript theme={null}
import "@blaxel/telemetry";
import { startSpan } from "@blaxel/telemetry";
const span = startSpan("span-name", {
attributes: {
"input": JSON.stringify(userInput),
},
});
try {
// ... your code here ...
span.setAttribute("action.result", JSON.stringify(result));
} finally {
span.end();
}
```
```python Python theme={null}
import blaxel.telemetry
from opentelemetry import trace
tracer = trace.get_tracer(__name__)
with tracer.start_as_current_span("span-name", attributes={"input": user_input}) as span:
# ... your code here ...
span.set_attribute("action.result", str(result))
```
You can call `startSpan` anywhere inside a request handler, and the span will be attached to the active trace for that request.
## Opt out
This feature is controlled by the `BL_ENABLE_OPENTELEMETRY` environment variable.
When you deploy an agent to Blaxel, the platform automatically injects `BL_ENABLE_OPENTELEMETRY=true` into the environment.
When developing locally, this environment variable is not set and therefore defaults to `false`.
To explicitly disable telemetry:
```bash theme={null}
export BL_ENABLE_OPENTELEMETRY=false
```
Setting `DO_NOT_TRACK=1` has no effect on OpenTelemetry.
[Read more about SDK and CLI data collection and privacy](/Security/Data-collection-and-privacy).