Quotas
Quota tiers
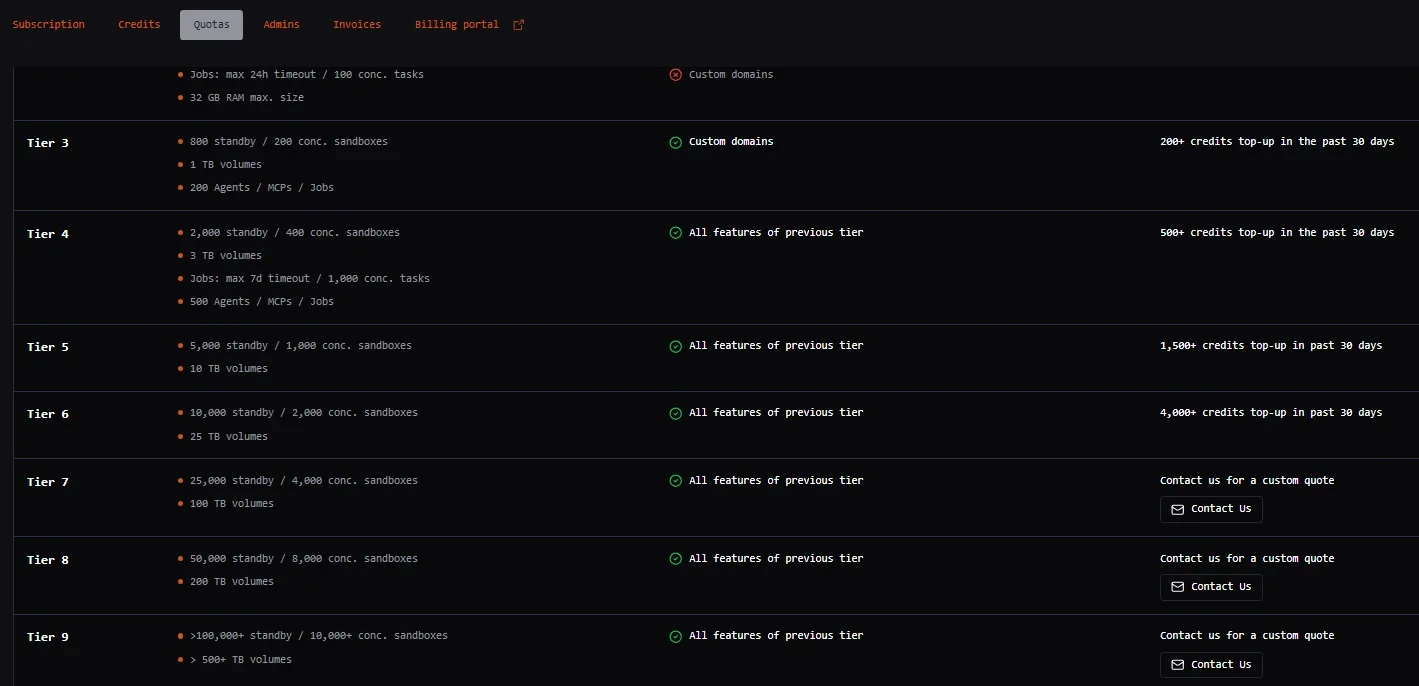
Blaxel has a quota tiering system that unlocks higher limits and features on the platform as your tier progresses. Higher tiers have access to higher limits such as more standby/concurrent sandboxes, more concurrent jobs, higher sandbox and volume sizes, longer sandbox TTLs. They also have access to gated features such as custom domains, dedicated IPs and more. You can see the limits and features of each tier in the Quotas tab.- Click the workspace name at the bottom left of the Blaxel Console.
- In the sub-menu, click Account.
- Click the Quotas tab.
How tiers are calculated
Your current tier is evaluated continuously based on your 30-day top-up volume. This is the total amount of real funds added to your Blaxel wallet via manual or automated top-ups over the trailing 30 days. Top-ups are not flat fees: Funds added to meet a tier requirement are deposited directly into your account balance. These funds are subsequently used to pay for your standard compute and storage consumption. Promotional credits do not unlock tiers: Promotional credits (such as startup program grants) and previously accumulated balances automatically apply toward your active infrastructure costs. However, they do not count toward the 30-day top-up volume required to unlock or maintain a quota tier.Maintaining your tier
Because tier eligibility relies on a rolling 30-day window, your tier will automatically adjust if your top-up volume decreases. If your 30-day top-up volume falls below your current tier’s threshold, your workspace will be downgraded, which may result in blocked resource creation if you exceed the lower tier’s limits. To prevent service disruptions and maintain your quotas without manual intervention, you can configure Auto top-up in the Billing section of your Console.Quota usage
Blaxel also lets you view and manage quotas associated with your account. Quotas for your account are listed in the All current quotas section.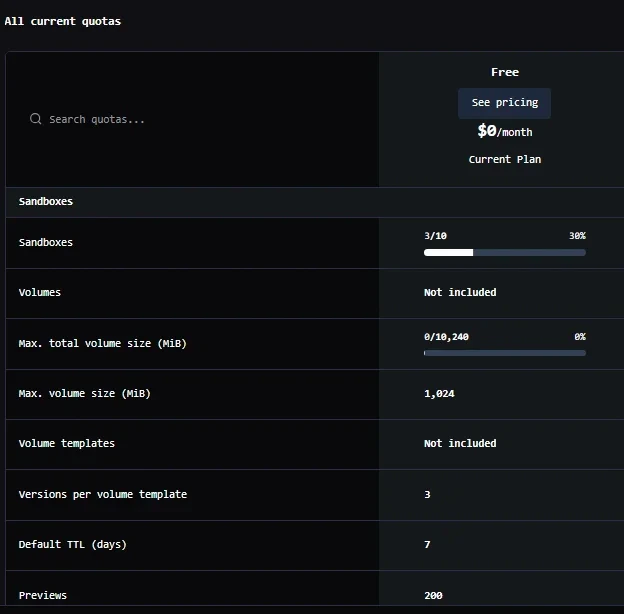
- Deployed sandboxes, agents, MCP servers, model APIs, policies, triggers, and jobs
- Sandboxes: volumes, volume templates, default TTL, previews, volume sizes and versions
- Jobs: maximum parallel executions, maximum concurrent tasks
- Workspaces: users, service accounts, integrations, custom domains, revisions, timeouts
Increase account quotas
Automatically increase quotas via top-up
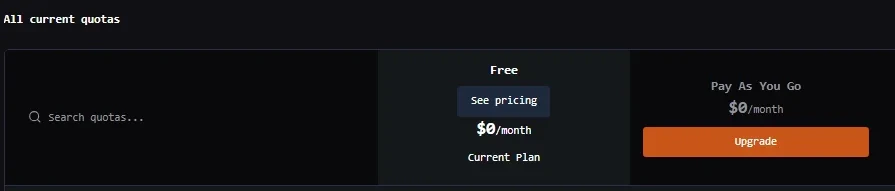
To unlock access to higher quotas and limits, you must upgrade to a higher tier by topping up the appropriate amount of credit in your account. These top-up amounts go directly into your Blaxel wallet. This is not a fee for the tier itself, but rather a pre-payment for the usage you are about to run.Manually request a quota increase
Upgrading to a higher tier is the usual way to unlock higher quotas for your account. In case of issues, it is also possible to manually request an increase in quotas for your account through the Blaxel Console. To do this:- Click the pencil icon.
- Input the requested quota value.

Accounts on the free plan are not eligible for quota upgrades and will not see the option to request a quota increase in the Blaxel Console.
Best practices for quota management
Configure sandbox TTL
Keeping inactive sandboxes in standby consumes snapshot storage and counts against your quota limits. To optimize costs and quota usage, we recommend setting a Time-To-Live (TTL) of 7 to 60 days (depending on your re-activation patterns) to automatically prune dormant sandboxes.Monitor usage alerts
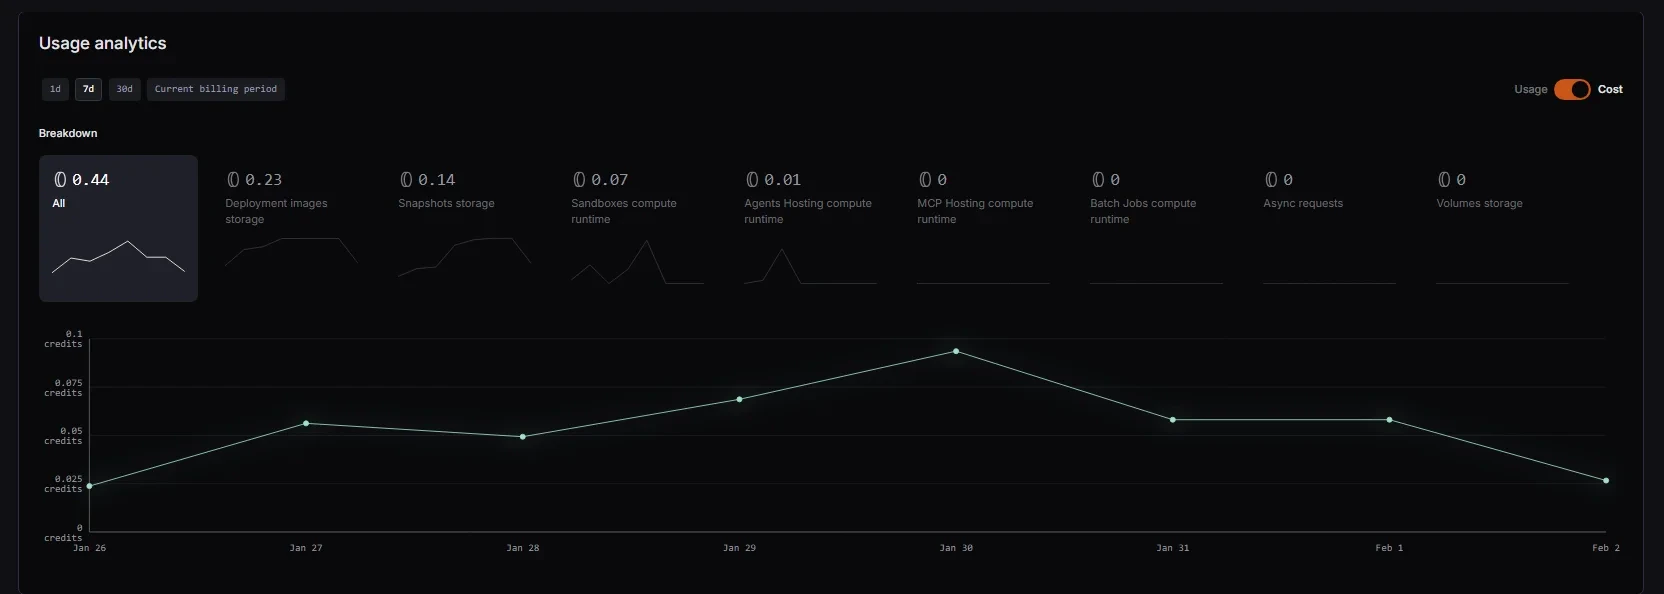
Blaxel automatically dispatches an email notification to workspace administrators when your infrastructure usage reaches 90% of your current tier’s quota.Analytics
Blaxel Billing Explorer provides detailed cost and usage analytics at account level. These metrics are available for the current billing period, last 30 days, last 7 days, and last 24 hours. To view usage analytics for your account:- Click the workspace name at the bottom left of the Blaxel Console.
- Click Account.
- Click the Subscription tab.
- Navigate to the Usage analytics section of the page.
- Total compute runtime usage/cost for sandboxes, agents, batch jobs or MCP servers
- Total deployment image and snapshot storage usage/cost
- Total volume storage usage/cost
- Total number/cost of asynchronous requests